![]()

![]()
You can create new dashboards and add the reports that you created to the dashboard.
To create new dashboards:
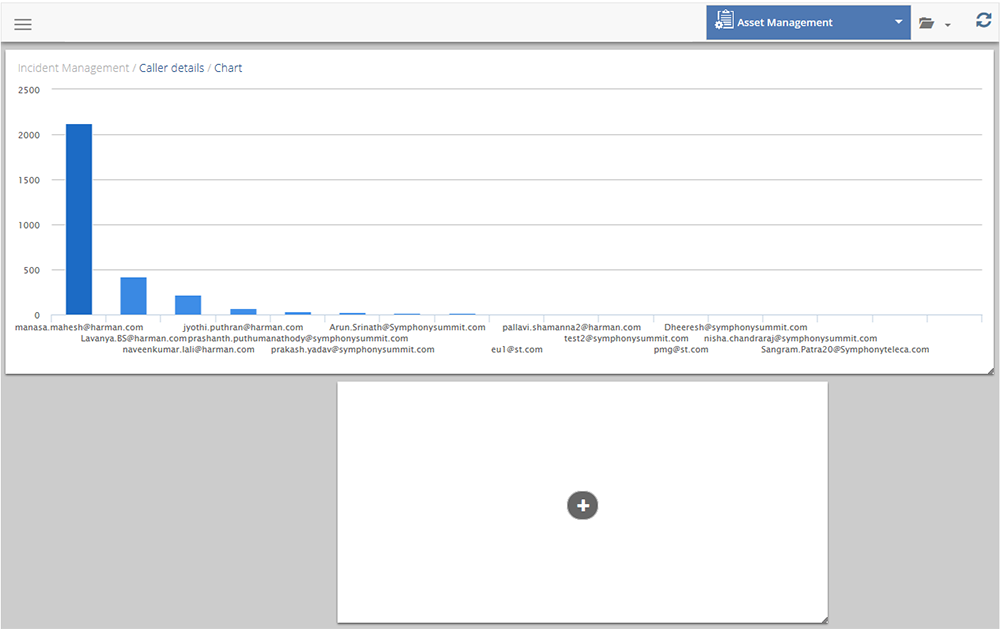
Select Reports > Select the Module > New Dashboard icon ![]() . A blank dashboard page is displayed. For more information about the icons on the dashboard page, see Field Description.
. A blank dashboard page is displayed. For more information about the icons on the dashboard page, see Field Description.
![]()
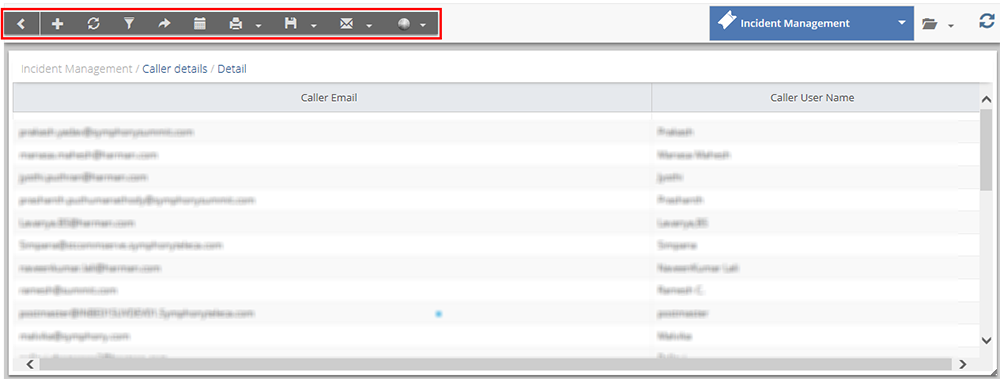
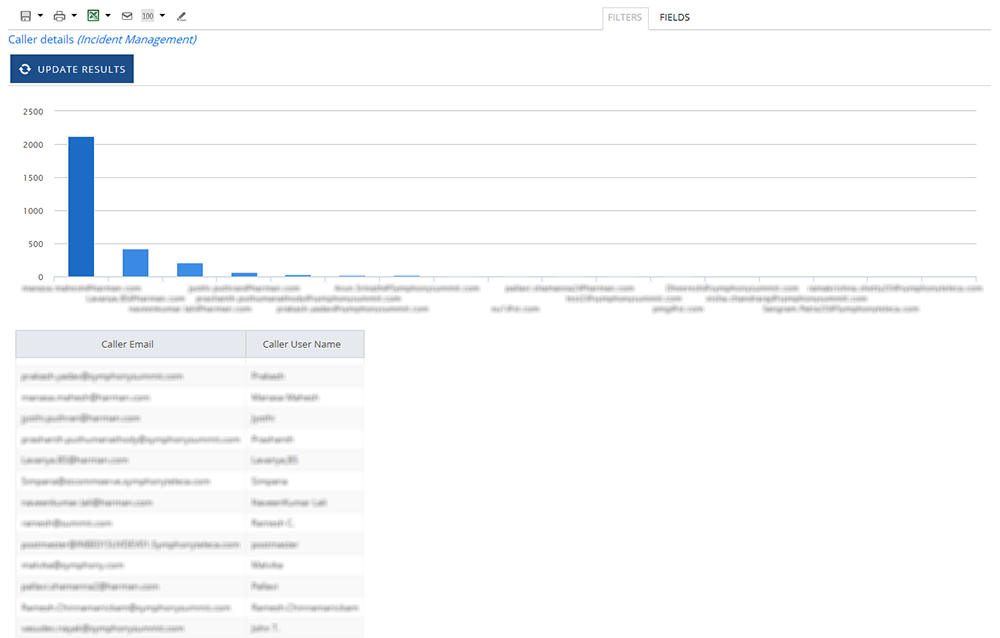
To add reports to the dashboards:
 See Screen shot.
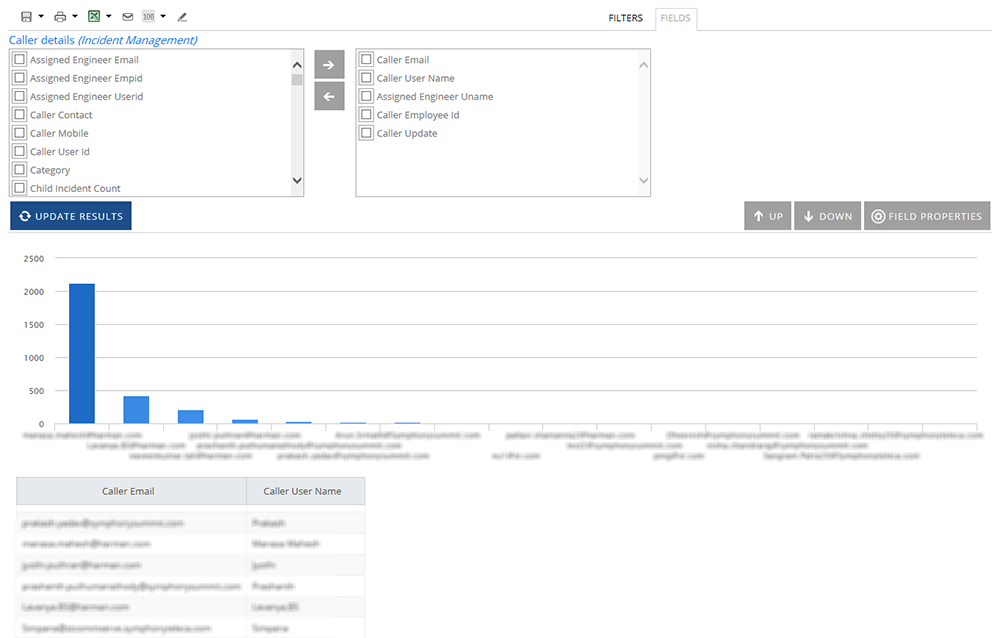
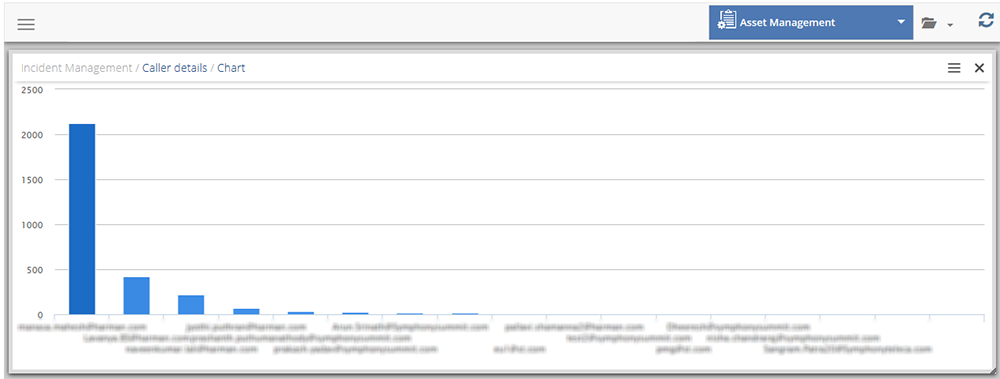
See Screen Shot.
The following table describes the icons on the dashboard page:
| Field | Description |
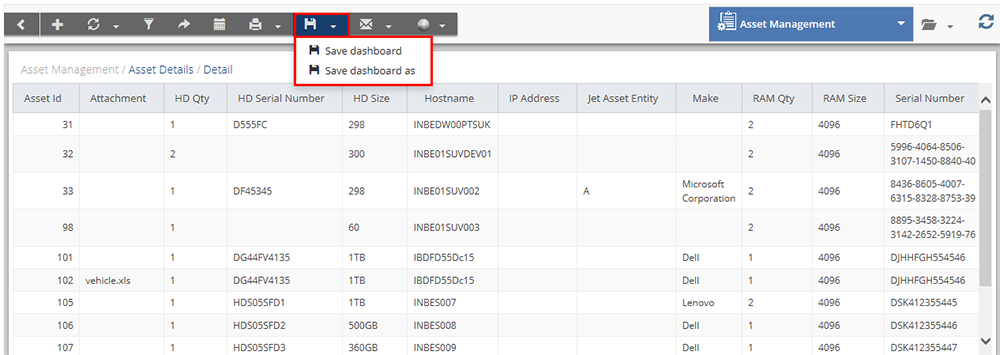
| Click the icon at the top-left corner of the report to view the menu options available for the Dashboard. See Screen Shot.
|
|
 |
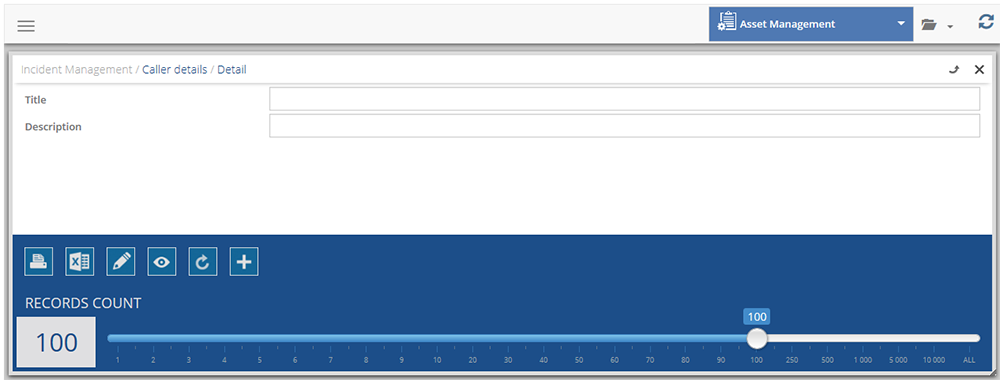
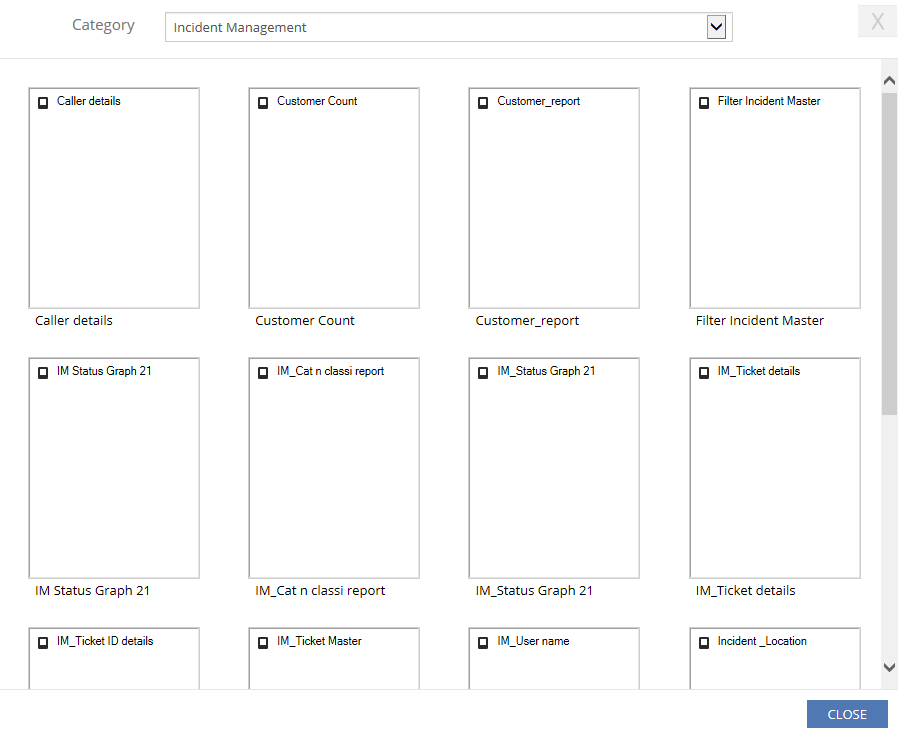
Select the module from the drop-down menu to view the related reports. |
 |
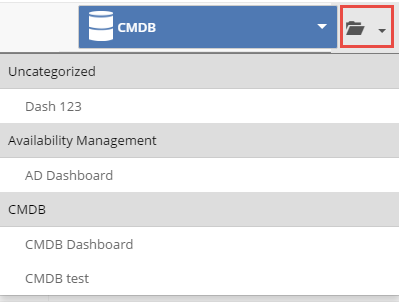
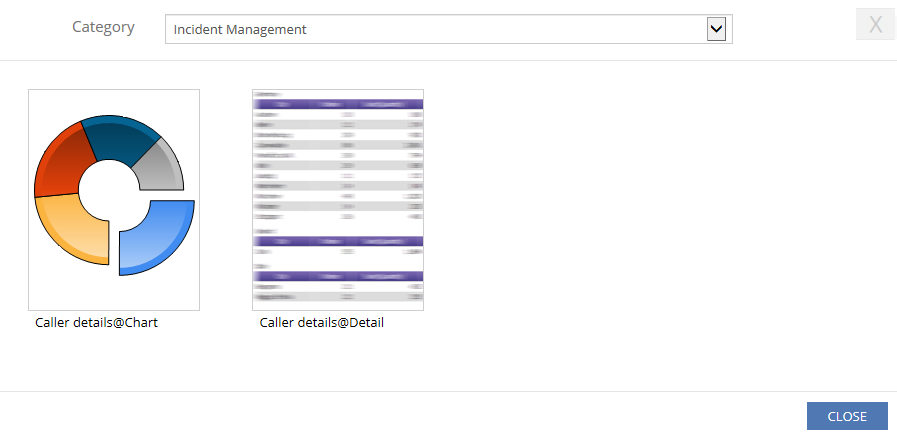
Click the Open dashboard icon to view the existing dashboard reports. See Screen Shot.
|
 |
Click the Refresh Report icon to refresh the reports. |
 |
Click the icon to remove the report from the dashboard. |
| Click the Show Tile Options icon to customize a report. For more information, See Screen Shot.
|